Key takeaways
- Fight Central Tendency Bias: The “Bell Curve” is a mental tool to stop you from rating everyone as “above average.” If you grade everyone nicely, your ratings become meaningless. Use this principle to force differentiation so you can objectively identify who is actually driving results versus who is just coasting.
- Allocate Resources by Impact: Use the curve to ensure your limited time, budget, and bonuses go where they matter most. Invest heavily in your Stars (top 10%) for retention, provide consistent coaching to your Core (70%) to maintain stability, and use targeted interventions or exits for the Drains (bottom 10%) to protect team morale.
- Reward Excellence, Not Mediocrity: If you treat poor performers the same as average ones, you kill the incentive for the middle to improve. If you treat high performers the same as the middle, your stars will leave for a company that recognizes their value. Differentiation is not “mean”, it is the foundation of a fair and high-performing culture.
Table of Contents
The bell curve performance rating is part of Monday Simon Manager Development Program:
👉 Module 5: Performance management for managers
What is the bell curve
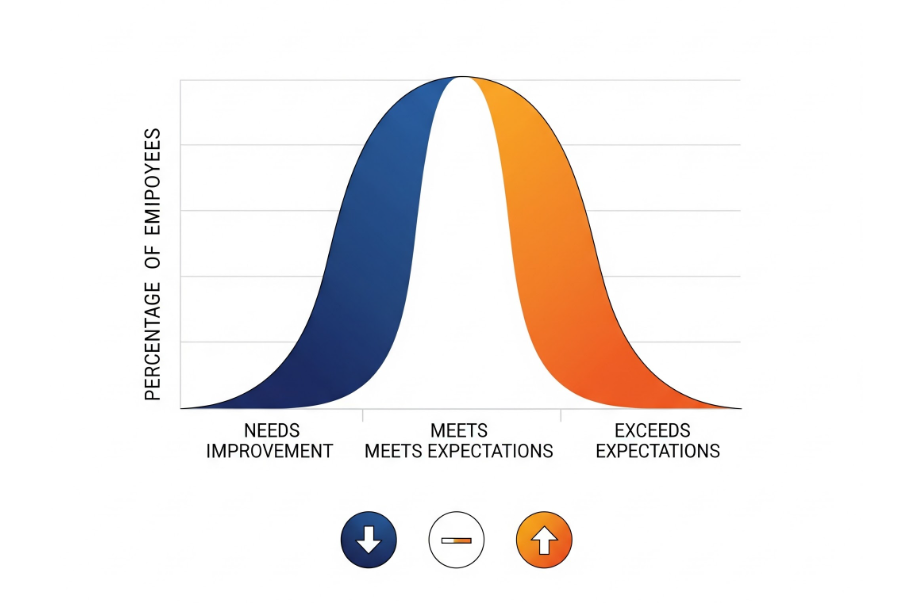
The bell curve is usually a term used by HR when it comes to yearly bonus allocation. As a manager, you must grasp that your team’s performance does not align in a straight line. Instead, it naturally forms a bell curve.
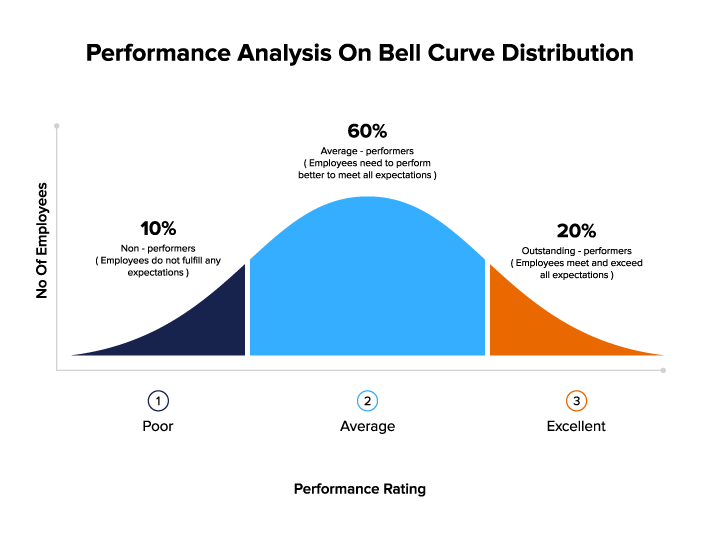
In any business, performance distribution typically looks like this:
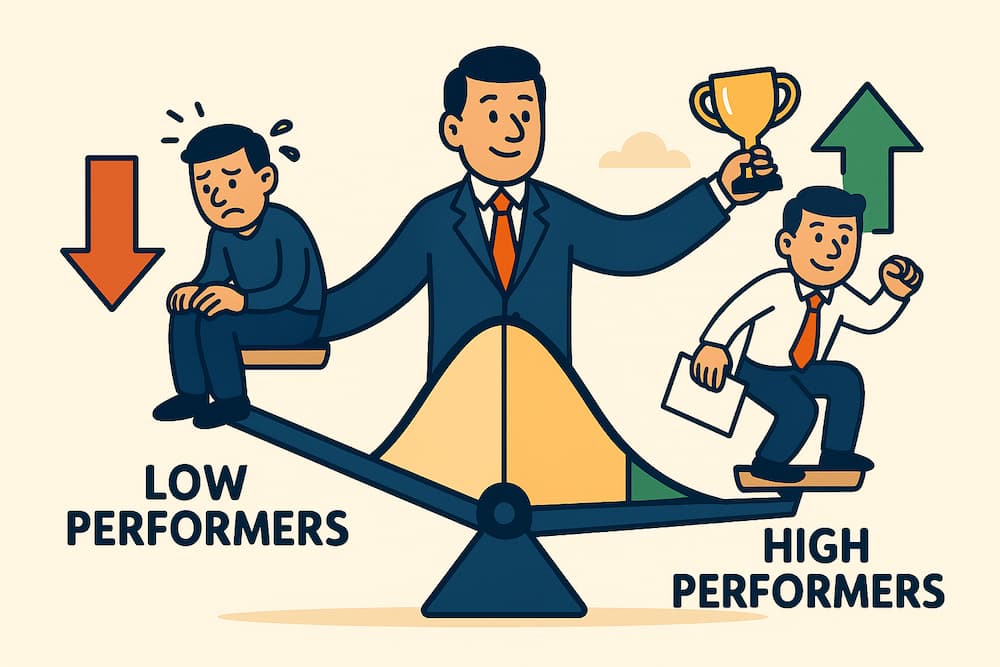
- Top 10% – These are your stars, the individuals who consistently exceed expectations, driving exceptional results. They are the ones who make your team stand out.
- Solid 70% – This group meets targets, maintains steady performance, and forms the backbone of your operations. They are reliable, doing what is expected, day in, day out.
- Bottom 10% – Unfortunately, this segment struggles to deliver consistently. They require your attention, either to improve or to consider if they fit within your team’s future.
The bell curve is not an absolute statistical model. It does not mean you should exactly have 10% of high performers in your team. I use it to explain to managers that not all performance is treated equally when it comes to performance management. Especially because:
- If you treat your Poor performers the same way as your average performers, your average employee is not incentivized to do a better job
- If you treat your high performers the same way as your average performers, your high performers are likely to leave.
So, you must understand the principles of the bell curve in your performance management process.
When you need to give tough feedback, recommend someone for promotion, or justify a termination, you can rely on this curve for fairness. It ensures your decisions are defensible, based on facts, not feelings. You can identify who sits on the curve upon the achievements of KPIs and OKRs. If you have not started to assign clear objectives to your team members, use my ChatGPT for goal setting. Fair performance evaluation is a fundamental principle in performance management that tells you that only a few people will be exceptional, a few people will be struggling, and the majority will cluster around average. It’s a harsh reality, but ignoring it means you can’t manage effectively.
Application in Management: Using the bell curve helps you:
- Identify your top performers for potential leadership roles or special projects.
- Support the solid performers with training or recognition to keep them motivated.
- Address the performance of the bottom 10% through targeted interventions, whether it’s coaching, reassignment, or, in some cases, parting ways.
When to Use The Bell Curve Principle
Apply the logic of The bell curve when facing these common managerial headaches:
- You are forced to allocate limited bonus or training money and need to ensure the funds go to the people who truly deserve and can utilize them most.
- You need to calibrate performance ratings across several teams or departments to ensure fairness and consistency, stopping managers from inflating scores.
- You are struggling to identify which employees to invest in for leadership development and which ones require an urgent performance improvement plan.
What Actually Works with The Bell Curve
HR often mandates a strict split, for example 10% high, 80% average, 10% low, but your team might be exceptional (shifted right) or struggling (shifted left). Use the principle of the bell curve to force differentiation, not the rigid numbers.
The point of using the bell curve thinking is to fight the manager’s natural tendency toward central tendency bias. If you genuinely believe that 90% of your team is a “top performer,” you’re either an incredible recruiter or you’re grading on a curve so nicely that’s becoming meaningless.
To implement this practically, you need to use Forced Ranking, or we can call it Performance Tiers. Take your team list and objectively rank them against each other using measurable, business-driven outcomes (e.g., revenue generated, defects per project, or client retention rate). Once ranked, use the shape of The bell curve as a guide for your three core groups:
- The Stars (7-15%): These people are at the high end of The bell curve. They consistently over-deliver. Your action is Retention and Investment. Give them the biggest bonuses, the toughest projects, and fast-track them into leadership training.
- The Core (70-85%): The vast middle of The bell curve. They meet goals reliably. Your action is Coaching (Using the GROW coaching model) and Engagement. They need focused development to move them one step forward, not massive investment.
- The Drains (5-15%): The low performers on The bell curve. They consistently miss goals and require excessive management time. Your action is Action or Exit. They need a clear, 90-day performance improvement plan. If they don’t improve, they need to go, or they’ll drag down your Stars and Core.
You must accept this model to ensure that resources (money, time, development opportunities) are allocated efficiently based on proven business impact. Any system that avoids the inherent reality of The bell curve is simply rewarding mediocrity.
Head over to my Manager tools page if you wish to discover additional resources for managers.
MORE MANAGER DEVELOPMENT RESOURCE
This article is part of our performance management resources.
Stay sharp for Monday
Practical resources to help managers lead smarter, faster, and with confidence.

High Performers: Your Ultimate Advantage for Team Success
View Article
What Is Performance Management? A Practical Guide for Managers
View Article